Even if most information today is already available at a hands reach, which is usually a smartphone, there is a point in making some important information even easier to access. In a previous video, I’ve already talked about how an airline company used the color of a flower to indicate their sales, so this time I wanted to create something even more visual, and decided to make a world map show the current state of each major stock exchange and finance.
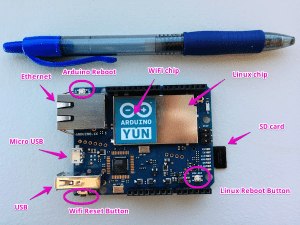
 To do that you need an Arduino Yún, an RGB LED strand (at least with 25 pixels), a 5V power adapter (for 25 pixels you need at least 1.5A, for 50 3A, etc), a female connector, 3 jumper wires, and a board with world map that has 12 mm (0.45″) holes for each stock exchange location.
To setup the hardware, you start by disconnecting everything from its power source, and then connect the Arduino GND to the strand GND, the Arduino pin 2 to the strand data pin (usually yellow or white), the Arduino pin 3 to the strand clock pin (usually green), the power adapter minus to the strand GND, and the power adapter plus to the strand VCC – the last two via the female connector (more details on connecting the strand can be found on https://learn.adafruit.com/12mm-led-p…).
The (PHP) code for the omnichannel service that query the current stock exchange status and return an array of statuses can be found on http://cforsberg.com/?p=262.
It starts by getting the current change percent for each stock exchange from Yahoo (on lines 2-3). Then it extract the rows (on line 4), and creates an array (on line 5) to store each status. It loops over each row (on line 6), set each status (on line 8), and then the statuses are returned comma-separated. This service can be deployed to a cloud server with the name colors.php, and I showed how to do that in my video called “Omnichannel Services – First Service”.
The Arduino code (sketch) to get the statuses from the omni channel service and set the colors of the corresponding LEDs can be found on http://cforsberg.com/?p=262. After the initial includes (on lines 1-3), variables are defined for the network client (on line 5) and the LED strand (on line 6). Then some more variables are define (on lines 7-8), like an array with the LEDs that are to be shown on the map (as the cables between each LED is short, it means that some will not be used as the end up between the holes in the map). In the setup, I initialize the bridge (on line 12, that connect the microcontroller to the microprocessor) and the strand (on line 13), and turn off all of the LEDs (on line 14). The eternal loop starts by getting the content from the omnichannel service (on lines 19-26, and replace 0.0.0.0 with the IP of your server), extract each status (on lines 27-34), and set the LED color depending on the status (on line 32, and the colors are set using the function on lines 39-42). Then the new colors are sent to the strand (on line 35), followed by a five second delay (on line 36), before the loop starts over again.
Now you can get an instant update on the financial market in the world by just looking at the map. This is just one example of how you can visualize financial information, and another would be to use the map as a business intelligence dashboard by putting an LED on the map for each office that your organization has, and then let the colors show a KPI for each office – it could be revenue, sales, profit, utilization, etc (selected with buttons on the map).
That’s how the Internet of Things can be used in the finance sector.
Thank you Chris Forsberg for such an Insightful description of Internet of things in Finance.


